|
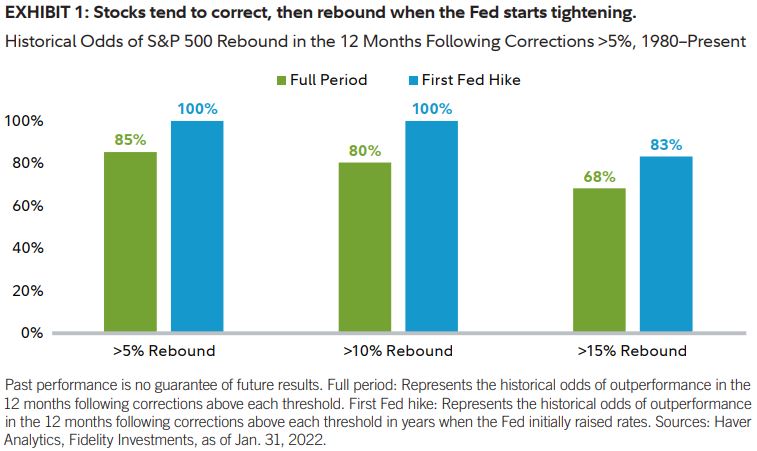
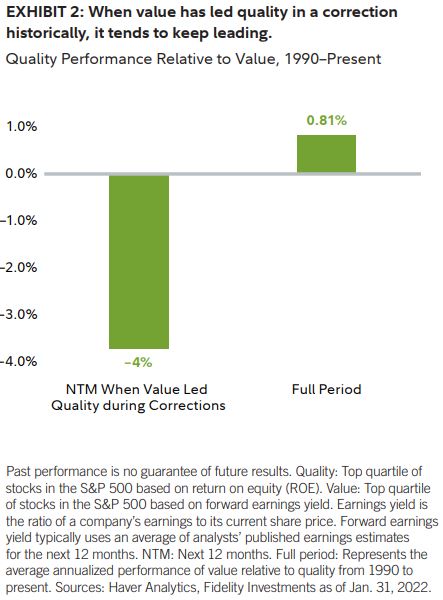
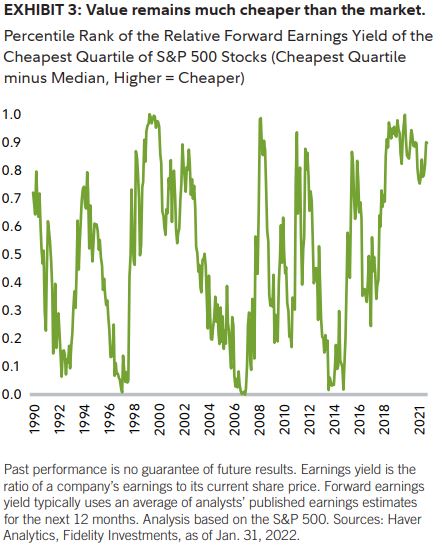
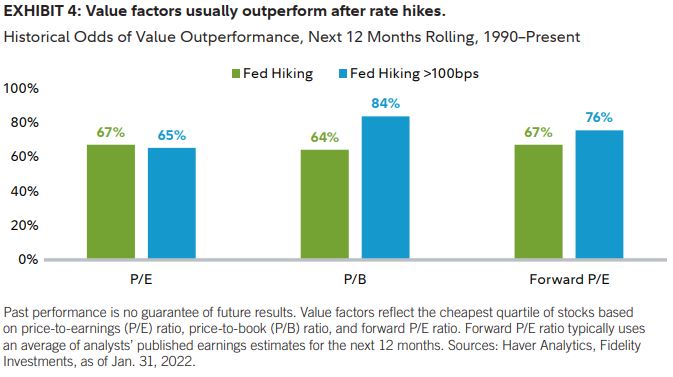
Corrections are common, and so are rebounds While they can be unsettling, stock market declines greater than 5% are a normal part of the market’s cycle. Thirty-six of the 42 calendar years since 1980 have had sell-offs of more than 5%, including 19 greater than 10%. Corrections have been especially likely when the Federal Reserve (Fed) starts raising interest rates: Each first rate hike in a tightening cycle has prompted a more than 5% stock market decline. But investors should remember that rebounds are just as common as corrections. Since 1980, every time the Fed has started raising rates, stocks have followed their initial drop with a gain greater than 10% (Exhibit 1). Value beat quality in the correction, and may keep leading High-quality stocks—shares of companies with especially strong fundamentals—have outperformed value stocks during two-thirds of corrections, historically. This time, though, value led quality. Should investors tilt toward higher-quality stocks to take advantage of lower prices? Maybe not: After past corrections with value leadership, quality trailed value by a wide margin over the next 12 months, on average (Exhibit 2). Value stocks remain cheap, implying further leadership Valuation metrics also make value’s leadership look sustainable for 2022. Value stocks have been consistently cheap this cycle, relative to history. Even after the recent correction, the S&P 500’s least-expensive quartile trades at a historically extreme discount to its median stock, based on forward earnings yield (Exhibit 3). Value stocks have outperformed the market more than two-thirds of the time from comparable relative valuations in the past, with average outperformance of 12%. Value tends to outperform after interest rate hikes too Investors who worry about the impact rate increases will have on stocks may want to look to value for protection. Value factors across the board have tended to outperform the market following Fed rate hikes (Exhibit 4). The likely reason: Rate increases usually reflect strong economic growth, which can improve the prospects of beaten-down companies with improving earnings. Based on these dynamics, value stocks continue to appear well positioned. I believe that the current disconnect in valuation—with cheap stocks continuing to trade at extreme discounts relative to the broader market—is likely to be a more persistent driver of value stocks than many of the other macroeconomic dynamics investors are considering.
Source: Chisholm, Denise. Fidelity Investments. 2022 March 15. https://institutional.fidelity.com/app/literature/item/9905173.html
2 Comments
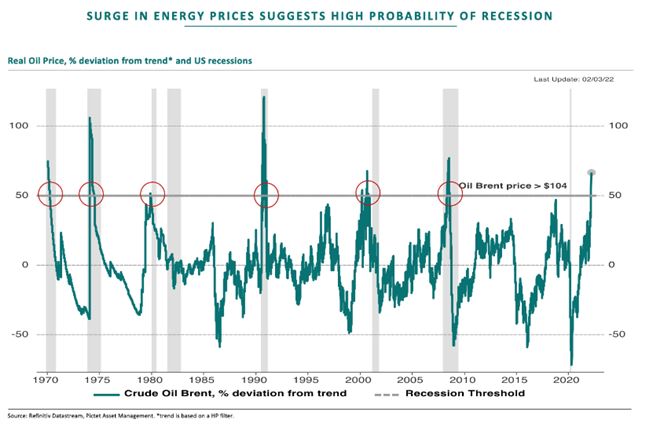
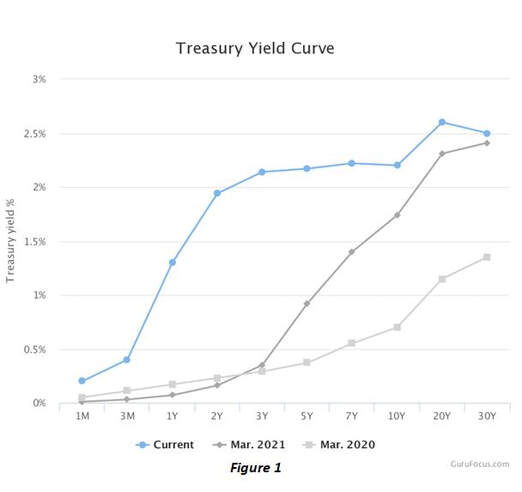 Traditions Wealth Advisors Noah Skrudland/Brien L. Smith, CFP® Financial Analyst Intern/TWA Owner Ukraine/Russia Update: It seems as if the war in Ukraine is not broadening. Negotiations with Russia are continuing, and some insiders believe a solution should come by the end of March or early April. This is an optimistic viewpoint, but there are no signs of Putin getting more aggressive and threatening allied countries, yet. Still, the biggest economic impact of this crisis is the commodity price shock. With energy and commodity prices already rising, uncertainty and supply disruptions are hindering growth and driving inflation. Ukraine and Russia are also major exporters of wheat, fertilizers, and sources of industrial metals. So, we could see increasing prices from several sectors. Central Banks and Interest Rates: Typically, Central Banks raise interest rates when the economy is hot. Increasing rates will increase borrowing costs and will slow economic growth. However, when the economy is slowing down then Central banks will lower interest rates to induce economic activity and growth. Last Wednesday, March 16th, the Federal Reserve began its rate hike in the hope to combat the spiraling inflation. They raised rates by 0.25% last week and signaled a forecast for six more 0.25% or 0.50% hikes by the end of the year. Fed Chair, Jerome Powell, stated that he supports a faster pace increase in interest rates for upcoming meetings. This would include rate hikes greater than a quarter percent increase. Recession Risk: As of right now, many macro-economic teams do not call for a U.S. recession. However, there are several risks that need to be closely examined. First, an inverted US Treasury yield is a sign that has been used throughout economic history as a recession indicator. An inverted Treasury yield is defined as when short-term bond yields exceed long-term bond yields. Many economists like to compare the 2-year and 10-year treasury yields to determine if it is inverted. As of today (3/21/2022), the 2-year yield sits at 2.14 and the 10-year at 2.32. Figure 1 to the left shows the Treasury Yield Curve as of March 21, 2022. Since the late-1970s, every inverted yield curve has led to a recession. It should be noted that inversions do not cause recessions but are merely a symptom. Second, higher oil prices tend to slow economic growth. Nine of the last 11 recessions have been preceded by sharp rise in oil prices (Ned Davis Research). Unlike inverted yield curves, oil shocks do have the ability to be a leading cause of a recession. Figure 2 below shows past surges in energy prices and US recessions. We currently believe these are the most prominent indicators of a recession. Again, there are few economists that believe the US is in danger of a recession due to our strong labor market, solid consumer spending and savings cushions, and better-than-expected corporate profits. But we believe it is important to closely watch these two indicators for the following months as the Federal Reserve continues to tighten its monetary policy. Economic Perspectives: https://mailchi.mp/b0393d780534/ukraine-impact-special-edition-3
|
Archives
July 2024
Categories
All
|
Let our team work for you. Call 979-694-9100 or
email [email protected]
|
TRADITIONS WEALTH ADVISORS
2700 Earl Rudder Frwy South, Ste. 2600 College Station, TX 77845 |
VISIT OUR BLOG: Stay current with industry news and tips.
|
