|
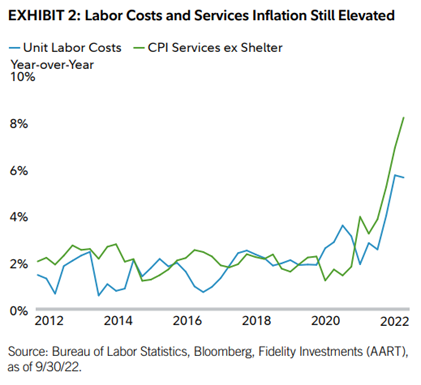
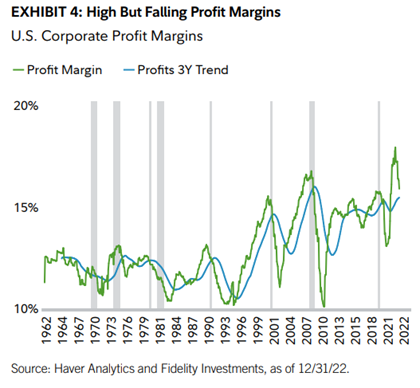
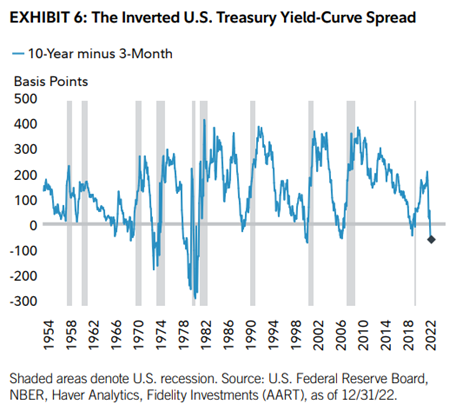
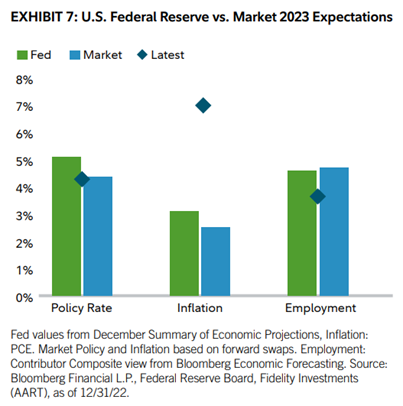
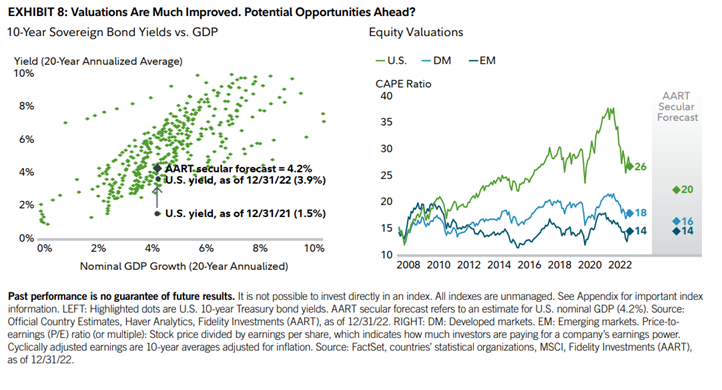
I. Summary: The main factors that affected the market selloffs (a situation in which many investors sell their shares of a stock suddenly, often because of bad news) of equities and bonds during 2022 are still relevant today in 2023. These include high inflation, tightening monetary policy and higher interest rates, slowing U.S. and global economic growth, and geopolitical turmoil. However, it is how these factors evolve that will be critical to the 2023 outlook. Top Things To Watch in 2023 Fidelity expects inflation rates to decline in 2023 but remain higher than what the market expects. Two key indicators to keep track of to determine when inflation may slow in 2023 are the housing and labor markets. Inflation peaked at above 9% in 2022 -the highest in four decades- the good news is inflation has decelerated to about 7% year-over-year in the second half of 2022 and is expected to be headed toward a further significant slowing in 2023. This has caused supply-chain disruptions to improve, energy prices to drop off their recent highs, and prices for most goods to come down late in 2022. The bad news is that financial markets have priced in a return to low and stable inflation quickly and painlessly, which many analysts and economists believe is not the case. The key to 2023’s outlook is the degree to which disinflation occurs in services industries, which often sees sticky inflation. A weakening housing market could help slow rental inflation rates in 2023. Labor markets will be a main focus for disinflation as well, where employee costs typically have had a heavy influence on the price of services. There have been signs of softening demand for labor, but aging demographics and other structural issues may continue to restrain labor supply and keep wage growth above levels compatible with 2% core inflation. The potential for stickier wages to continue supporting elevated labor costs means inflation could be more persistent than commonly believed. There would need to be a much larger weakness in the labor market and a significant increase in unemployment for the market’s low inflation forecasts to be correct. Monetary Policy Inflation trends are now headed in the right direction and the Fed may be in the final innings of its tightening cycle. Current market pricing indicates a belief that the Fed could stop hiking at around 5% by mid-2023 and possibly begin easing policy by the second half of the year. However, analysts at Fidelity do not expect inflation to come down as quickly as the market expects. They also believe that the fed will be willing to tolerate some economic pain through higher unemployment to make sure core inflation continues downward toward its 2% target. U.S. Business Cycle Leading indicators suggest that recession risks could continue to rise in the coming months. Credit conditions have deteriorated as lending standards at banks have tightened, the treasury bond yield curve remains inverted, inventories have risen as sales decreased, while new orders for manufacturing goods have also declined. Company profit margins have fallen, which is typical of the final months of the late-cycle phase. According to consensus estimates, the market expects positive earnings growth of about 3% in 2023. It’s possible that earning growth will hold up better than the 18% average decline during typical recessions, but Fidelity analysts think there is downside risk relative to market expectations. Economists are also following employment markets and consumer spending in 2023 Consumers’ willingness to spend may be threatened by savings rates that have dropped to near all time lows, the apparent exhaustion of excess savings for low and some middle-income cohorts and falling asset prices. On the upside, labor markets appear structurally tighter and more supportive of medium-term wage growth. Additionally, household balance sheets remain in good shape, the increase of fixed-rate mortgage debt implies a lack of financial stress, and falling inflation may boost real (inflation-adjusted) income growth. Interest Rates By the end of 2022, long term 10-year Treasury yields dropped well below the shorter term 3-month Treasury bills. This steep inversion of the current US Treasury bonds yield curve –with long term rates higher than short term rates– is historically a leading economic recession indicator and a sign that the financial markets believe that at some point in the future the Fed will have to start cutting rates in reaction to economic weakness. Economists are keeping track of business cycle indicators previously mentioned to monitor whether a U.S. recession becomes the dominant story of 2023. Investment Conclusions Overall, Fidelity analysts believe that both inflation and policy rates could remain higher than current consensus investor expectations. The Fed’s latest inflation and interest-rate projections tend to agree, markets are overly optimistic at the moment. Uncertainty around these trends is likely to persist well into 2023, implying high odds of continued market volatility and heightened need for portfolio diversification. However, this greater market volatility could provide even greater opportunities to purchase assets at discounted prices. Over the past 11 recessions since 1950, a diversified portfolio of stocks and bonds has returned an average of 6% and 11% over the one- and two-year periods after the start of a recession. Valuations are perhaps the most important indicator of expected returns over the medium and long term, and 2023 is a more attractive starting point for valuations than at any time in the past decade.
0 Comments
Consider these strategies to help counter fear of loss so you have the potential to grow your money. Fear of loss is a powerful motivator. But fear, like greed, is a dangerous sentiment for investors. Excessive fear of loss—which behavioral economists call loss aversion—causes many investors to act counterproductively. Fortunately, you don't have to treat growth and protection as mutually exclusive. Certain strategies can help you benefit from market gains, while protecting you on the downside.
No one has ever successfully and consistently predicted stock market returns. The strategy of jumping in and out of the market is known as market timing; investors who try to time the market typically sell after their investments have lost money, and buy only after stocks have recovered—selling low and buying high. Avoiding stocks altogether has major drawbacks too. Stocks provide the potential growth nearly every long-term investor needs to stay ahead of inflation. Cautious investors with long-term saving goals—those who will not need to access a portion of their assets for 5 to 10 years—may benefit from strategies that allow them to protect principal while exposing some of their assets to the stock market's growth potential. If you fit that description, consider the following strategies: the anchor strategy or the protected accumulation strategy. 1) Anchor strategy An anchor strategy involves dividing your portfolio into 2 parts: a conservative anchor and more growth-oriented investments. The anchor portion of your portfolio uses investments that offer a fixed return, such as certificates of deposit (CDs) or single-premium deferred annuities (SPDAs). These assets have a set lifespan, and the amount you invest is designed to grow back with interest to your original principal. This portion of your portfolio acts as your anchor, while your remaining assets are invested in more volatile, growth-oriented securities such as stock mutual funds or ETFs. The anchor strategy can remove the negative outcomes cautious investors sometimes fear because even if the markets fall, your anchor makes sure you at least have what you started out with. *Tip: Remember, inflation can erode the purchasing power of your original investment over time and this strategy generates taxes each year in a taxable account. 2) Protected accumulation strategy Here's how it works: the protected accumulation strategy takes advantage of principal protection features on variable annuities. A guaranteed minimum accumulation benefit (GMAB) rider on an annuity is the most basic of these. Your assets are invested in a portfolio that typically has a larger equity position than the roughly 15% stake outlined in the anchor strategy above. For a fee, the GMAB rider guarantees that at the end of the annuity's investment period—typically 10 years—you'll have at least the same asset value you started with. Another potential benefit is that most GMAB riders let you reset the level of principal protection each year if your investments have grown in value. If you do lock in a higher balance, the investment period resets and your balance is guaranteed for another 10 years. It is possible that your fee may increase if you elect this option and annuity features will vary by the issuing company. Which loss aversion strategy is right for you? Determining which, if either, strategy may make sense for you will depend on a number of factors, including your investing goal, interest rate environment, fees on your investments, your time horizon, and your tolerance for risk. First consider if you might be better off investing in a diversified portfolio, because either of these strategies (anchor or protected accumulation) may limit your upside growth potential—and the diversified portfolio may offer a greater long-term benefit. You also need to consider when you will need access to these assets, because both strategies might penalize early withdrawals. Consider working with your financial professional to sort how to protect your principal while keeping a watchful eye on your overall goals, diversification of your portfolio, and exposure to taxes. Questions? Contact us at [email protected] [email protected] Source: Fidelity Viewpoints. 22 March 2023. https://www.fidelity.com/viewpoints/retirement/fighting-loss-aversion?ccsource=email_weekly_0330_1037579_36_0_CV2 |
Archives
July 2024
Categories
All
|
Let our team work for you. Call 979-694-9100 or
email [email protected]
|
TRADITIONS WEALTH ADVISORS
2700 Earl Rudder Frwy South, Ste. 2600 College Station, TX 77845 |
VISIT OUR BLOG: Stay current with industry news and tips.
|
